
Different Types of Infographics Design

A visually appealing graphic perhaps created using AI Design tools, or Word document having similar information. Which source would you prefer to read first? Which one of them would likely have a long-lasting imprint on your mind? The visual graphic. Right?
Table of Contents
This beautiful graphic, representing one of the many infographic types including marketing infographics, crisply displays the information and is nothing but an infographic. An infographic that is designed, through a meticulous infographic process, to turn a complex subject into an easily digestible piece of information. With the diversity in infographic styles, this tool can cater to various needs and preferences. In recent years of social media, infographics, including different types of infographics, have become highly popular among individuals and businesses, each employing a unique infographic style to convey their message effectively.
In this blog, we are going to understand the importance of infographics for business. Also, how different types of infographics designs are utilized in the corporate world. Before moving ahead, let us have a better idea of what infographics are.What are Infographics?
An infographic, a versatile tool encompassing different types of infographics, including education infographics, can be your handy and affordable visual tool whether you are a marketer struggling for increasing user engagement or a team leader finding ways to communicate effectively with your team. Among various infographic formats, the timeline infographic examples are particularly effective in showcasing chronological data.
An infographic is a combination of the words 'information' and 'graphic'. Thus, an infographic stands for a visual representation of information, often utilizing formats like time infographics to convey temporal data. It aims to make data easily understandable at first glance. Following infographic best practices, the best infographic design contains minimal text to explain a concept, simplify data, map relationships, show trends, and provide important information.
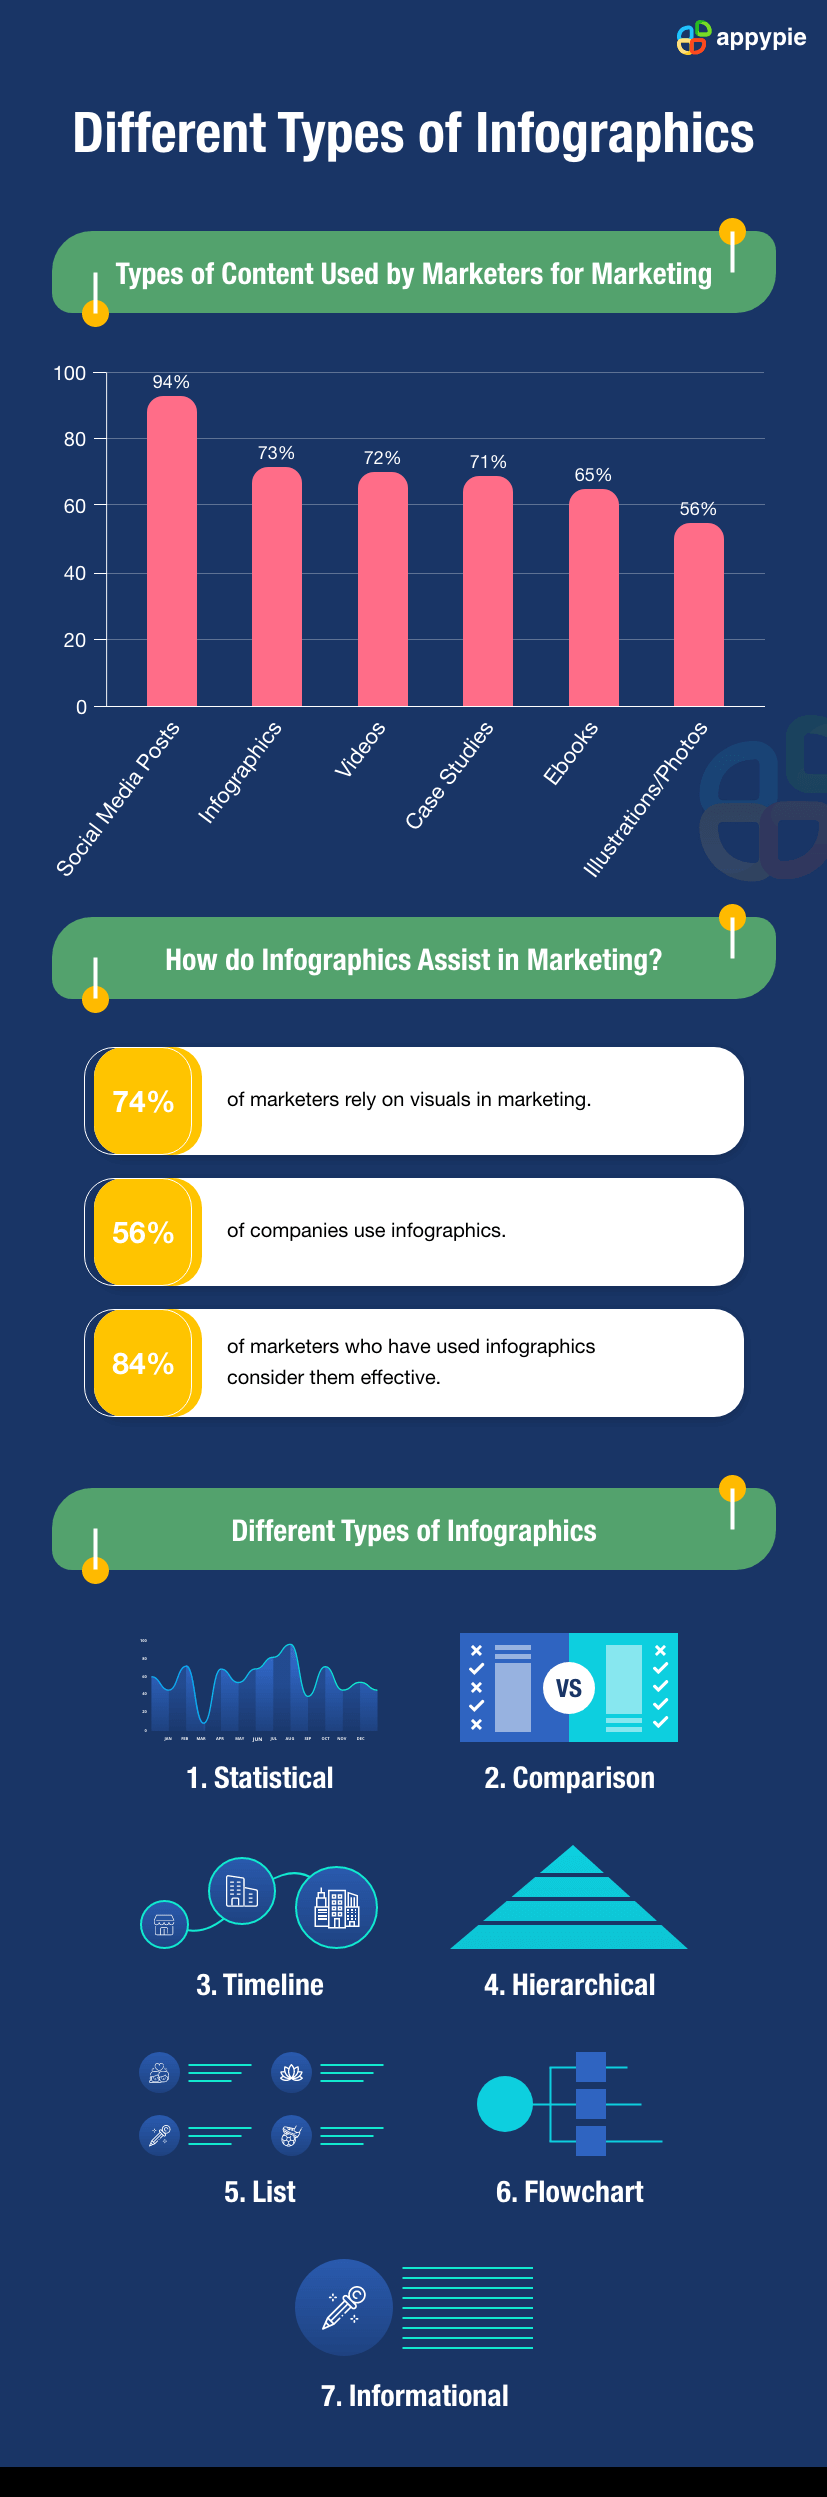
Here we have added an eye-catchy infographic for your reference which describes the importance of infographics, exemplifying the different types of infographics and their uses.
Why Use Infographics for Your Business?
Infographics, often created using tools like a graph maker, are not a recent invention but have existed as the best means of communication since early cave paintings and Ancient Egypt’s hieroglyphics. One might wonder, what type of information is best suited for infographics? The answer lies in their history and evolution. After the use of computers expanded and the internet wave changed the way of living, infographics became more important than ever before. Presently, they have turned into the best form of marketing tool and means of communication for businesses. This is largely because they are ideal for presenting complex data, statistical information, timelines, and processes in a visually engaging way. Several other benefits of infographics include:
- Making an abstract idea easily understandable to the audience
- Helping to convey data in a crisp and compact form
- Saving grace of small businesses in content marketing
- Engaging people on social media platforms
- Sharing dense information efficiently with the audience
- Creating better recall value of a brand
- Making technical information easier for the audience to comprehend
- Highlighting special services or products of your brand
- Increasing conversion rates
What are Different Types of Infographics?
There are various types of infographics, including different infographic templates, that can be utilized by businesses to attract their audience. Each type serves a different purpose and is used to display different type of data or information. Then, how to choose the relevant infographic? Actually, it all depends on the goal of your infographic and the type of information you want to display. Here is the list of 5 most commonly used infographic types.- Statistical Infographic
- Pie charts, pictograms, bar graphs, and other statistical tools are used to display data
- Percentages, figures, and other digit-format are deployed to communicate statistics to the audience
- Specific layouts and visuals tell the story behind the data
- A combination of bold fonts and colorful icons are utilized to drive the attention of people to each statistic
- Key data can be displayed in contrasting colors
- Comparison Infographic
- Helping to identify the pros and cons of each item added for comparison
- Dividing layout into two or more sections depending on the quantities compared
- Comparing two products, the graphic splits into two halves, either vertically or horizontally
- Keeping apart two options with the help of contrasting colors
- Emphasizing one option with more eye-catching color
- Timeline Infographic
- Used to highlight important dates or to provide an overview of events
- Act as medium to display different data points across the timeline
- Graphics are accompanied by images, icons, and other elements
- Layout used can vertical, horizontal, or winding
- Every year is emphasized either in large font or contrasting color
- Color gradient is used to show time progression
- Necessary description of the event is given, when necessary
- Hierarchical Infographic
- Pyramid and organizational chart are the commonly used layouts
- Graphics used to visualize the chain of commands
- Descriptive title is used to contextualize the data
- Different contrasting colors are utilized to display each level
- Icons, small elements, data, figures, and facts are used as supportive
- List Infographic
- Displays basic list in the form of eye-catchy graphics
- Points are either numbered or shown in bullet format
- Creative fonts and color combination help each point stand out
- Layout can be simple listicle format, vertical list or can be little creative like S-shape
- Color of fonts, icons, and elements vary to keep design engaging
Statistical infographic as its name implies is used to display the statistics. The statistics could be related to anything and everything depending on the purpose of your business. 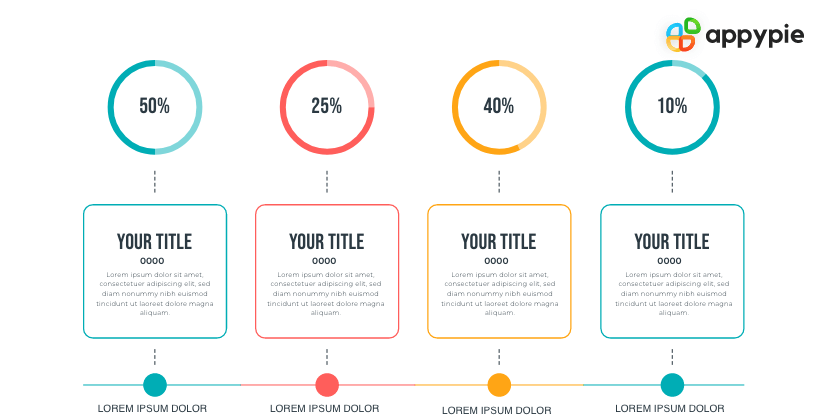 Some of the features of the statistical infographic are:
A comparison infographic is used to display the comparison (differences and similarities) between two or more products, services, ideas, etc. Comparison infographics designs suit both to compare two options unbiasedly and to emphasize on one option. 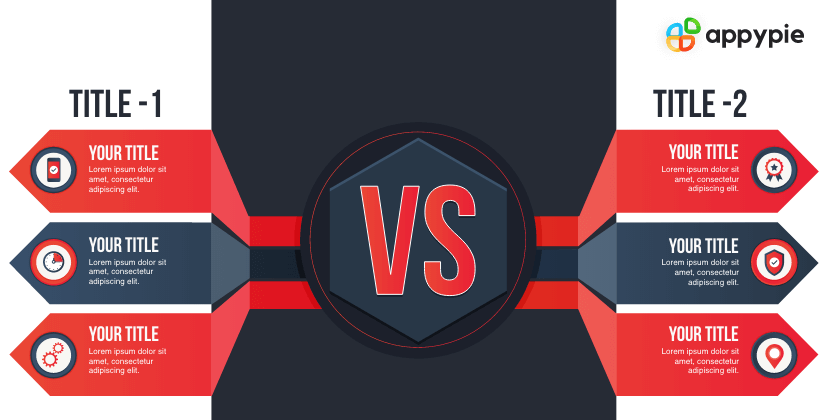 Some of the features of the comparison infographic include:
Timeline infographic shows how something has evolved the historical development of a product, trend, or business. It is used to display the events or actions chronologically in a timeline frame.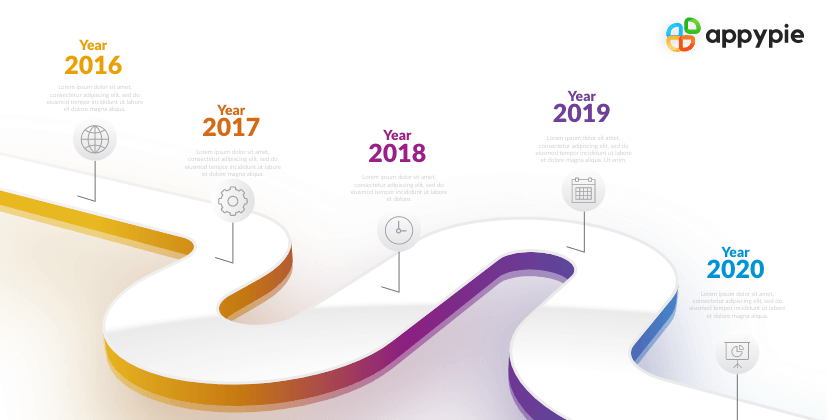 Some of the features of timeline infographics designs are mentioned below.
A hierarchical infographic is used to organize data in form of levels- which could be levels of evolution, level of importance, level of difficulty, etc. The major functions of hierarchical infographic design are used to compare different levels and explain the relationships among them.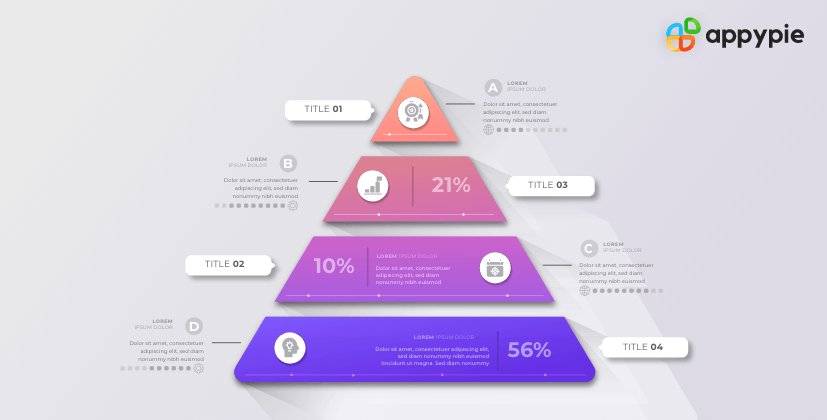 Some of the features of a hierarchical infographic are mentioned below.
List infographic is basically used to share a list of resources, useful tips, a list of examples, or any topic which includes a listicle. After examining various list infographics examples, it can be advocated that they are one of the easy, fun, and quick ways to display the extensive data.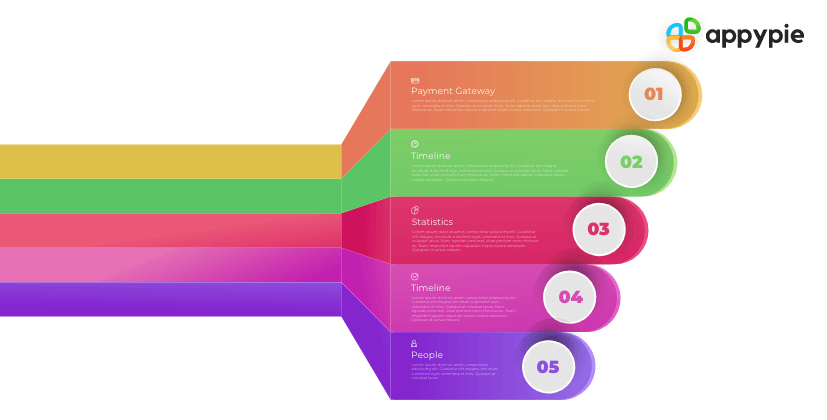 Some of the major features of the list infographic are mentioned below.
How to Make Infographics Design on your own?
Visual content is paramount in the era of internet and social media. It differentiates your brand from competitors and helps your audience immediately recognize your brand. To make your digital marketing strategy more efficient, you shout start creating visually appealing infographics designs today. Appy Pie’s Infographic Maker can help you make every type of infographics in a jiffy. The software allows you to experiment with your creative instincts on the user-friendly interface that it offers. To set your business-level high, you must start experimenting with various tools on the customizable templates provided by Appy Pie’s Infographic Maker.Summing Up
In the past year, creating an infographic design to display the data in a visually appealing format was difficult. But, as the availability of online tools increased, it became easy to create infographics and utilize different growth opportunities. You must create an infographic today and start displaying information to your audience in one of the most creative ways.Related Articles
- Chartreuse Color: Unveiling Its History, Shades, and Impact in Design
- 51+ Creative Blog Headers to Attract and Engage Readers
- 10 Tips to create a Perfect Organizational Chart
- How to Click Aesthetic Pictures: A Beginner’s Guide
- Content Marketing AI: How Artificial Intelligence is Changing the Game [10 Effective Ways]
- Land Your Marketing Emailers Directly In The Gmail Primary Tab
- How Typing Test Improves Your Typing Speed
- ID-Animator: Zero-Shot Identity-Preserving Human Video Generation
- How to Use Twitter for Marketing? [A Competitive Guide]
- How to Blur Background Using AI?
Most Popular Posts
- Types of Balance in Art: From Symmetry to Asymmetry
- Sales Cycle Secrets- Boost Efficiency & Customer Satisfaction Today
- What are Ethics and Bias in LLMs?
- How to Create a Discord Server [Set up and Manage a Discord Server]
- 10+ Blog Examples to Guide Your Blogging Journey: Find Your Niche, Find Your Voice