
How to Make an Infographic Using AI? [7 Simple Steps]

“A picture is worth thousand words.” The effectiveness and popularity of visual content in the digital market can’t be ignored. The best way to promote your brand digitally is by using infographics. Even though creating an impressive infographic consumes a lot more time and effort than writing a simple blog post, but you just can’t afford to give up on them. Instead, you can find an easy way to design them for your business.
Table of Contents
After reading this blog post, it might not be difficult for you to create an attractive infographic all by yourself. Here, we will recommend you the seven easy steps to create an excellent infographic for your business. Before proceeding further, let us first have a clear understanding of what an infographic is and what are its major elements.
What is an Infographic?
The word infographic is the combination of words ‘information’ and graphics’. An infographic comprises charts, imagery, information, diagrams, graphics, and much more. It is an illustration of relevant information that helps in making the data engaging and easily understandable at a first glance. An ideal infographic with the minimal use of text can be a great tool for explaining concepts, displaying data, mapping relationships, simplifying presentations, providing insights, and showing trends. With the right use of compelling images, an infographic can help you come up with abstract ideas to gain popularity in marketing. Infographics help convey information in a simple and shareable form making it easier to digest at first glance. There are various infographic making tools available online. Among all those software, Appy Pie’s Infographic Maker is the best. It comes with various effective drawing and editing tools to help you create infographics that stand out. We will talk more about the software later in the blog. Also, we will study essential visual elements of infographic along with the steps to create one. Let us first go through an excellent example of an infographic with the combination of both data and visuals to make the content more prominent, shareable, and easy to understand.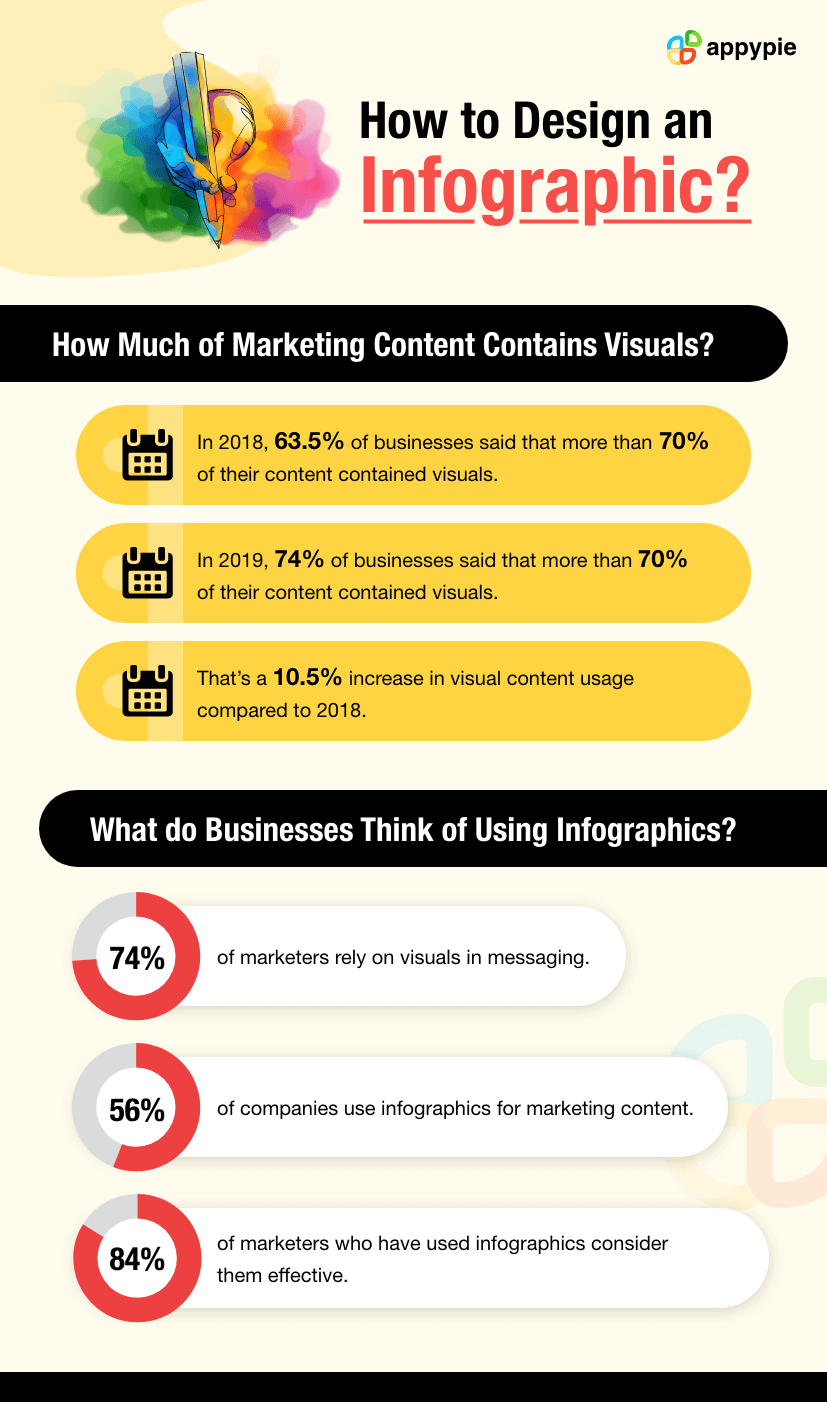
Visual Elements of an Infographic
Although there are different types of infographics there are a few key elements that are the same in them all. These elements help a visual representation of data and information qualify as an infographic. Here are the elements of a good infographic.- Infographic Colors
- Infographic Icons
- Infographic Fonts
- Serif Fonts
- Sans-Serif Fonts
- Script Fonts
- Decorative Fonts
- Infographic Images
- Infographic Tools
Your selection of color scheme can make or break your piece. This is one of the most effective and eye-catching aspects of an infographic. With colors, you can either make the piece of information clear or vague. Sometimes the selection of colors depends upon the nature of the graphic.
For example, if you are creating an infographic for a food blog, you will use red for something that tastes like cherry or cinnamon. Green for something that tastes like apple or lime. It all depends. The right selection of colors in your infographic can attract people to read the content.
Make sure you use your brand colors when creating infographic color schemes. However, there is no harm in using some colors that evoke certain emotions. For example, green shows environmental concerns, red and blue show trust and stability.
You can use Appy Pie’s Color Wheel to create your own infographic color palette and make your piece more attractive.
Using the right infographic icons can help you create an engaging infographic. Icons sometimes can be of best use when you look for packing plenty of information in little space. There are multiple ways you can use icons in your infographics. For example, if you are creating an infographic on different types of fruits, you can replace each fruit name with its specific icon.
If you want to create an icon for your brand, you can go for Appy Pie’s Icon Maker software. It helps you create your own icon in just a few clicks. The software offers various icon templates and custom icon designs that you can use to make a unique icon for your brand.Make sure your selection of icons matches the overall color, font, and themes of the infographic. If used right, icons help you explain the core message of creating the infographic.
There are so many fonts that you can use in your infographics. Although fonts can be divided in many ways, experts have classified them into four categories – All font types will not work with your infographic, the same as the case with colors. You must first figure out the purpose of your infographic and then look for the fonts available in your designer’s font collection. You can also download the fonts of your choice if working online. You can also generate fonts using AI Font Generator of your choice, ensuring a cohesive and visually appealing design.
Most of the basic rules applied for icons apply for images too. Make sure the images that you use are consistent with other graphics, colors, and themes used in the infographic. Avoid using regular images that have already been seen by readers on other websites or infographic designs. Even if your infographic conveys a unique message, the use of such images can dilute the impact and make your exciting message seem tired and boring. Think out of the box to make sure that your images are relevant and up to date. You can use the images of people and animals to make your infographic seem more personal.
You can create the images of your own or edit the ones you have, to add more meaning to them. You can use Appy Pie’s Photo Editor to edit your images and make them more expressive. The software comes with various effective photo editing tools that you can use to give your chosen images a unique and creative touch.
The design element is crucial when it comes to making an infographic. It takes a lot more than just using the right colors, fonts, and images. Although there are multiple infographic tools available online the one that I would recommend is Appy Pie’s Infographic Maker. The software comes with a wide range of effective features and lets you create your own infographic in just a few clicks.
The software offers hundreds of icons for free along with a gallery filled with hundreds of fascinating templates and geometric shapes to stick maps and figures. All that in different hues, sizes, and accents. All the templates and icons have been categorized based on industries such as economy, fashion, marketing, sports, science, education, and many more. This helps you easily find the icons that you need for your infographic.The best part about this software is that it is a browser-based app and can be accessed from anywhere using any device. All you need is an internet connection. How to Create an Infographic?
Creating an infographic is not about throwing your content and images onto a template. It takes efforts, creativity, and skills. Here are a few easy steps to help you create an amazing infographic that actually makes a difference.- Pinpoint Your Audience
- Define Your Goals
- Gather Data and Information
- Create Data Visualizations
- Create Your Layout Using a Template
- Customize Your Infographic
- Include a Footer with Your Logo and Sources
What is the use of creating an excellent infographic if nobody is looking at it? Your great ideas deserve an audience to appreciate, to act, or to give feedback. You must define your audience before you even plan to create an infographic for your brand.
Just targeting an audience doesn’t do the job, you need to know your audience, study their behavior, and learn what they expect from your brand. With this information, you can easily decide on the infographic tone, use the right colors, set the right dimensions of the infographic, and much more.
What is your purpose for creating this infographic? What goals do you want to achieve? Is the purpose to entertain, educate, or to advertise? Once you know what the goal of your infographic is, it becomes easy to word the copy, set the tone of the visuals, and choose the right design elements.
For example, the infographic above with marketing statistics has an informational goal. We have tried to convey information on how popular infographics are when it comes to marketing and what businesses think of using infographics. Hopefully, we did it right!
The time has come when you choose the topic for your infographic and start collecting the required details. You can find the data online if you know where to look. The easiest way to gather data is to start with Google. You can target your Google searches based on the relevant search terms.
You can also search for online data repositories to avoid cleaning the messy data that you get from Google. These repositories include Google Scholar, Pew Research, Statista, Kaggle, Cool Datasets, and many more.
Now that you have the answers to your questions and specific data to support your answers, you should start working on how to present that data and convey the information to the target audience. First figure out whether the primary goal of the data visualization is to inform, change, organize, compare, explore, or anything else. This helps you find the best infographic design template where you can fit in all your creative infographic design ideas.
The next step is to create a design and layout for your infographic. A good idea will be going back to the question pyramid you created in the first place while researching the market. Use these questions to create an information flow.
Begin with telling your audience what they will get to learn from your infographic. Next, you can place the charts supporting your point, and then take it to the end with the charts containing probing questions. Make sure your infographic is balanced and well-structured. You can use a predefined symmetrical grid to instantly elevate your infographic. This will help you place the elements in some essential order. It will direct the reader’s eye from element to element keeping in mind that we naturally read from top to bottom and left to right.
Also, if you don’t want to go through all this hassle of creating your own template, you can always go for Appy Pie’s Infographic Maker. Appy Pie offers hundreds of beautifully designed templates to help you create a well-structured infographic.
This is the most time-consuming yet fun part. First, come up with a catchy title for your infographic, plug in your content, and adjust fonts and formatting. Make the right selection and use of colors and graphics. Make sure they are relevant to your brand and the information you are providing. You can customize the look of your infographic by changing colors and font styles.
People while looking at your infographic must get to know who has created it. Do not forget to add your brand logo and sources at the bottom of your infographic. If your infographic gets shared on social media, your brand logo gets you recognized – which is what you actually want as a brand. Shareability is one of the major benefits of creating infographics.How to Make Infographics Using AI?
Appy Pie Design offers an AI Based Infographic Maker that lets you create your own infographics in minutes without acquiring any special design skills or installing software on your device. Here is how to create infographics in three simple steps using the AI infographic maker from Appy Pie Design.- Step 1: Go to Appy Pie Design Go to the AI infographic maker from Appy Pie Design and log in to your account if you have one, otherwise, create an account.
- Step 2: Enter Your Text Prompt On the platform, draft and enter a detailed text prompt that describes the infographic exactly how you want.
- Step 3: Generate & Download Click on ‘Generate’ and AI will give you the infographic you are looking for. You can edit it to your satisfaction and then download it in the format you want.
Final Thoughts
Creating an infographic is not just the job of an infographic tool. You need to plan, prepare, and then execute. While planning, you need to research the market, create different types of graphics, pick fonts, create color palettes, and much more. You need specialized tools for all these phases of the infographic creating process. Looks like Appy Pie comes with the whole package to help you create an engaging infographic. Check out the list.- Appy Pie Color Wheel for creating amazing color palettes
- Appy Pie Design for designing graphics
- Online Photo Editor to make your infographic images look more expressive
- Infographic Maker for making attractive infographics
Related Articles
- 10 Best Stripe Integrations for Online Payments
- The Allure of Violet Color Meaning, Hex Code, and Symbolisms
- 8 Best Photo Editing Apps to Use in 2023
- How to Create a Pivot Table in Excel Online
- Top 10 AI Story Generator Tools in 2024
- 5 Intake Form Examples That Work in Real-Time
- Mailchimp vs. Constant Contact – A Complete Comparison
- How to Use Oracle to Create a Powerful Chatbot
- Unlock the Power of Chatbots: Elevate Your Business with Smart Automation
- 7 Amazing Ways Mobile Apps Are Changing the Business of Entertainment [For Good]