
35 Call Center Metrics to Improve the Customer Experience

Ever wonder how call centers keep track of how well they're doing? Call center metrics are like measuring tools that track how fast agents answer calls, if customers are happy, and how many calls come in. By using these metrics, call centers can improve their service and make sure you get the help you need quickly and easily. This guide will explain all the different call center metrics you might hear about.
Implementing a call center software solution can help in effectively monitoring and analyzing these metrics. With the right software in place, call centers can automate data collection, generate insightful reports, and gain a comprehensive view of their performance. By using a call center software, businesses can make data-driven decisions to optimize their operations, enhance agent productivity, and deliver exceptional customer experiences.
What are Call Center Metrics?
Call center metrics are powerful tools that track how fast agents answer calls, how satisfied customers are, and call volume. By using these metrics, call centers can provide quick, efficient, and friendly service, making your experience a breeze.
Customer Experience Metrics
In the domain of call center management, keeping an eye on customer experience metrics is like having a compass guiding you toward success. These metrics help to measure how satisfied customers are with the service they receive and provide valuable insights into areas for improvement. Let's take a closer look at some key customer experience metrics:
- Net Promoter Score: NPS measures how likely customers are to recommend your call center to others. Think of it as a word-of-mouth rating. A high NPS means customers are recommending you to their friends and family! Monitoring NPS allows successful call centers to determine customer loyalty and identify opportunities to turn satisfied customers into brand advocates. NPS is calculated by subtracting the percentage of detractors (customers who rate their likelihood to recommend the call center as 6 or below) from the percentage of promoters (customers who rate their likelihood to recommend as 9 or 10).
- Customer Retention Rate: This metric tells you what percentage of your customers stay with your business over a certain period. If the rate is high, it suggests that your customers are happy and committed to your brand.
- Quality Assurance Scores: QA scores are similar to having a coach watching a game and offering feedback afterward. These scores evaluate the quality of interactions between agents and customers, ensuring that each interaction is top-notch. By regularly assessing QA scores, call center management can furnish targeted coaching and training to agents, thus enhancing overall service quality and customer satisfaction. Here a knowledge base software can empower agents with the information they need to deliver exceptional service during interactions. QA scores are typically rated on a scale (e.g., 1 to 10 or 1 to 5) based on predefined criteria for interaction quality. The average score across all interactions provides the QA score.
- Churn Rate: Churn rate is the percentage of customers who stop using your services over a specific period. Monitoring this metric is crucial because it reveals any dissatisfaction among your customers and pinpoints areas where improvements can be made in the customer experience.
- Customer Effort Score: CES measures how easy it is for customers to get their issues resolved. The easier it is for customers to get help, the happier they'll be. By focusing on reducing customer effort, contact center services can streamline processes and enhance the overall customer experience, leading to higher satisfaction levels and improved loyalty.
- Customer Lifetime Value: CLV predicts the total revenue a business can expect from a single customer over their entire relationship with the company. It helps in understanding the long-term value of acquiring and retaining customers.
- Customer Satisfaction Scores: CSAT scores, act as report cards for your call center's performance. They measure how content customers are with the assistance they've received. Imagine it like this: if a customer gives a high CSAT score, it's similar to earning a gold star for excellent service! Through the use of customer feedback from CSAT scores helps pinpoint strengths and areas for improvement, ultimately leading to improved call center performance. The assistance of ticketing systems can streamline the collection and analysis of CSAT data, facilitating more informed decisions.
- Customer Feedback and Surveys: Asking for feedback straight from your customers through surveys or feedback forms offers priceless insights into their experiences and satisfaction levels. This qualitative information supplements quantitative metrics like NPS and CSAT scores, giving you a well-rounded view of your customer relationships.
- First Contact Resolution: FCR measures how frequently issues are resolved on the first try. Customers greatly appreciate it when their problems are addressed quickly! Maximizing FCR not only boosts customer satisfaction but also diminishes call center operational costs by minimizing the necessity for follow-up interactions. During the initial interaction, employing an effective AI chatbot can help in resolving customer issues quickly. By integrating chatbot builder with call center metrics, businesses can gain deeper insights into customer behavior and preferences, enabling more targeted and effective communication strategies.
- Active Waiting Calls: This metric tracks the number of calls an agent is handling or awaiting. Managing active waiting calls is essential to prevent agent overload. Using efficient inbound call center software can assist agents in managing waiting calls effectively while ensuring timely customer support.
- Agent Effort Score: This shows us how much effort agents are putting into helping customers. It helps us see if agents are trying hard to fix problems fast. To improve your agent effort score, we can provide regular feedback and training sessions to help agents develop their skills and confidence. Improving Your Agent Effort Score: To enhance your agent effort score, focus on providing regular feedback and training sessions to empower agents with the skills and confidence needed to excel in their roles. Encourage agents to actively listen to customers, empathize with their concerns, and demonstrate genuine effort in resolving issues quickly. Make use of performance metrics and constructive feedback to identify areas for improvement and support agents in overcoming challenges. Foster a positive work environment that values teamwork, recognition, and continuous learning, motivating agents to consistently strive for excellence in customer service.
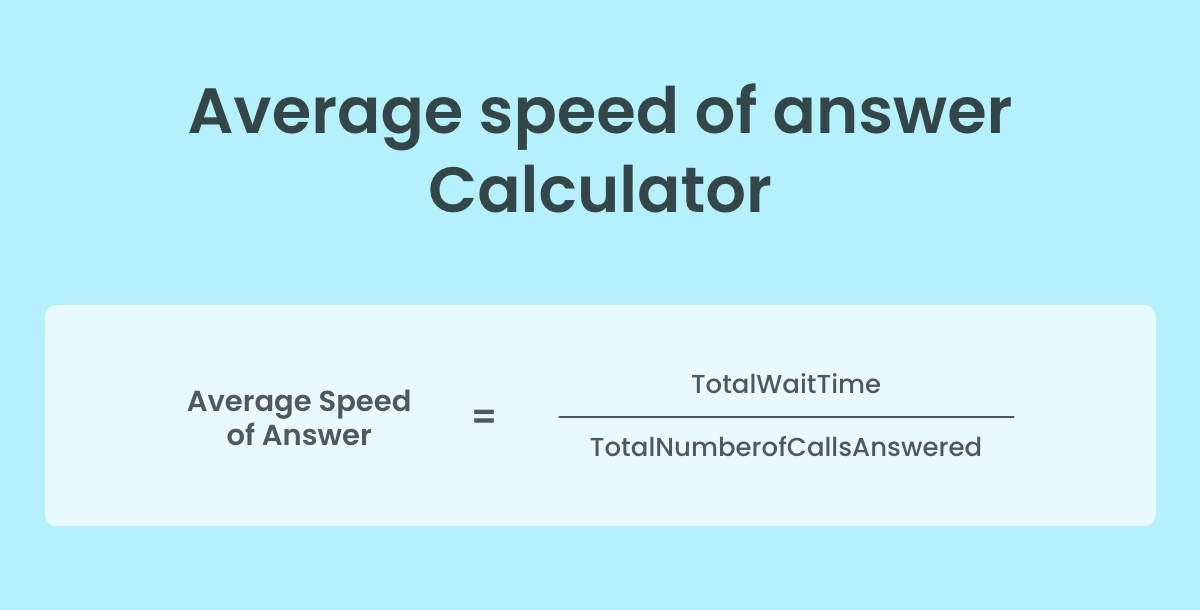
- Average Speed of Answer: This metric indicates how quickly agents respond to incoming calls. Rapid response times are critical for minimizing customer wait times. Implementing smart live chat software can streamline call routing, ensuring calls reach the right agents promptly. Improving Your Average Speed of Answer: To boost your average speed of answer, leverage smart inbound call center software that efficiently routes calls to the most appropriate agents based on their skills and availability. Implement strategies such as call queuing and automatic call distribution to minimize wait times for customers. Streamline internal processes and optimize agent workflows to reduce idle time between calls. Provide agents with comprehensive training on efficient call-handling techniques and empower them with access to relevant resources and tools. Continuously monitor call volume trends and adjust staffing levels accordingly to ensure optimal responsiveness to customer inquiries.
- Average Talk Time: This shows us how long agents spend talking to customers. We look at this to see if agents are working efficiently. With good training and tools like lead generation chatbot, agents can have shorter chats and help more customers in less time.
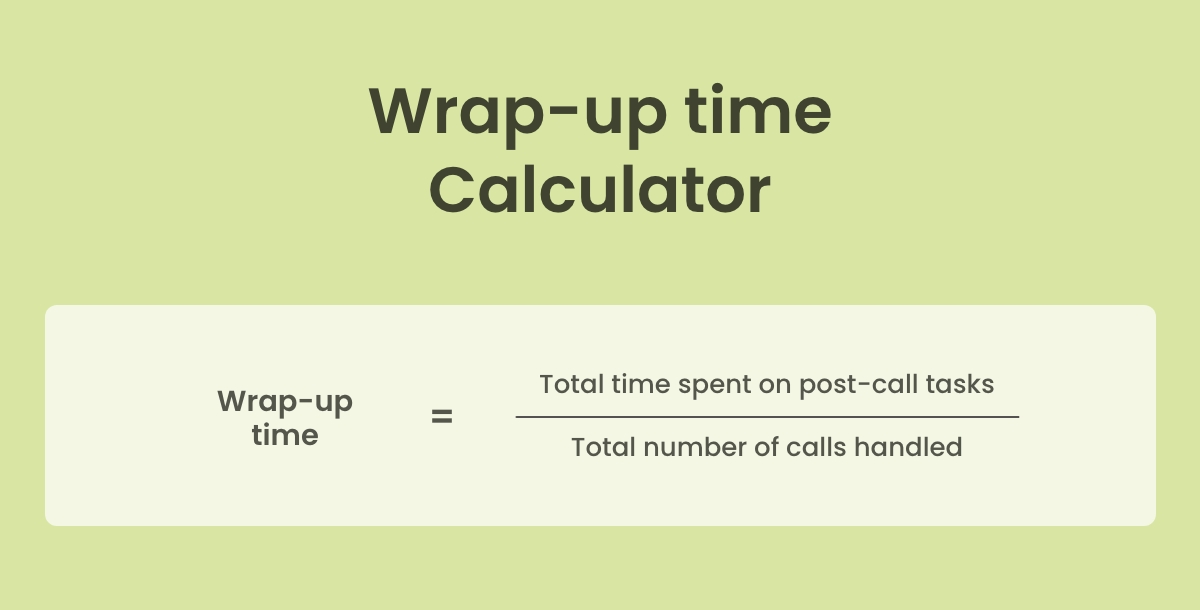
- Wrap-Up Time: This is how long agents take after calls to do things like update records. We watch this to make sure agents do these tasks quickly without keeping customers waiting too long. Using a good outbound call center can help agents finish tasks fast and get back to helping customers.
- Missed and Declined Calls: This tells us how many calls agents couldn't answer or chose not to take. It's important because it means customers might not be getting the help they need. Providing additional training and support can help reduce missed and declined calls, ensuring that all customers are attended to promptly.
- Total Resolution Time: This is how long it takes for agents to solve customer problems from start to finish. We aim to keep this time as short as possible so customers don't have to wait too long for solutions. Providing agents with access to comprehensive knowledge base software can help them find solutions faster, reducing total resolution time.
- Transfer Rate: This tells us how often agents transfer calls to other departments or colleagues. High transfer rates can frustrate customers and prolong resolution times. Implementing better training programs and improving communication channels can help reduce transfer rates, ensuring smoother customer interactions.
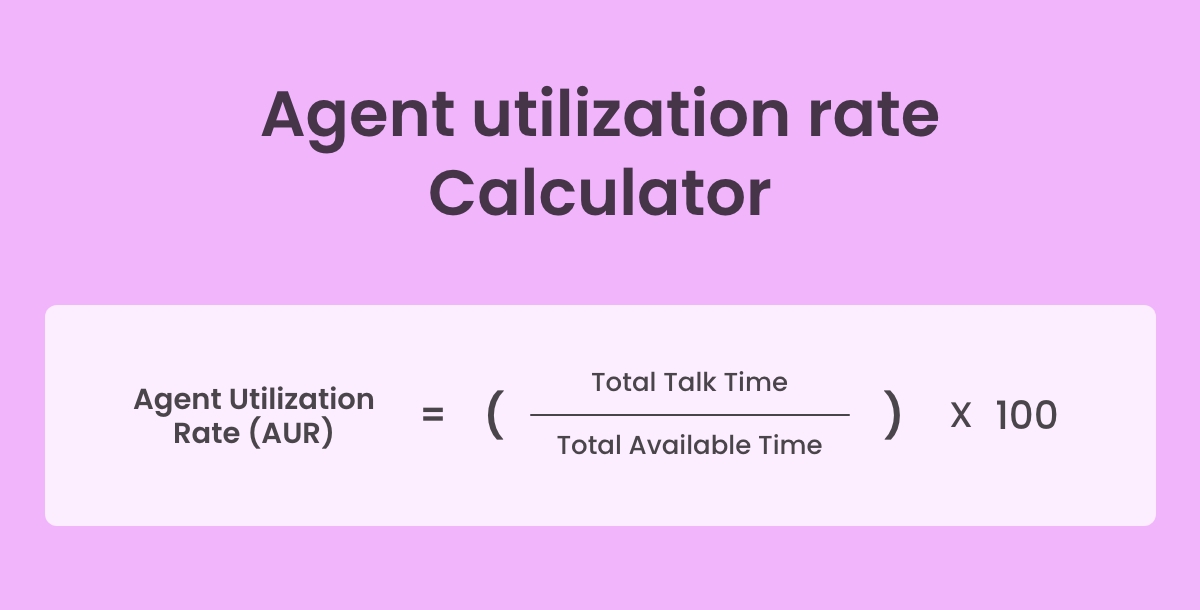
- Agent Utilization Rate: This shows us how effectively agents are being used during their scheduled shifts. It's important to make sure agents are busy helping customers without being overworked. Monitoring adherence to schedule and adjusting staffing levels accordingly can help optimize agent utilization rates.
- Adherence to Schedule: This measures how well agents stick to their assigned work schedules. It's important to maintain consistent service levels and ensure adequate staffing during peak hours. Providing agents with flexible scheduling options and clear guidelines can help improve adherence to schedule.
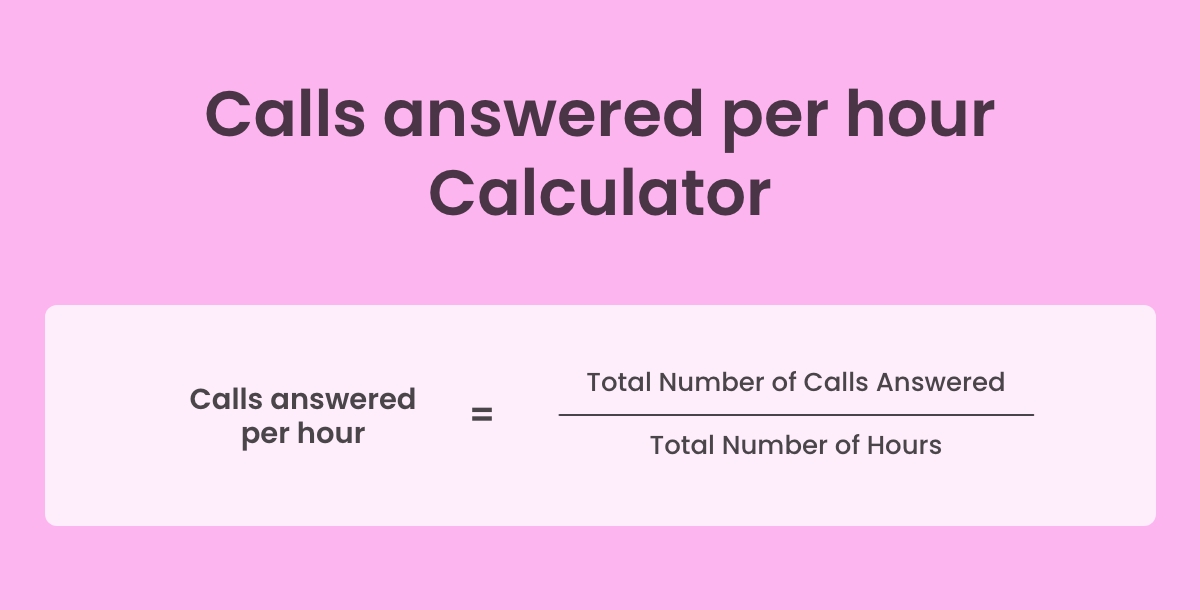
- Calls Answered Per Hour: This tells us how many calls agents handle within a specific timeframe. It's a measure of agent productivity and efficiency. Implementing tools like call center metrics focus on tracking performance metrics and providing regular performance feedback can help improve the calls answered per hour.
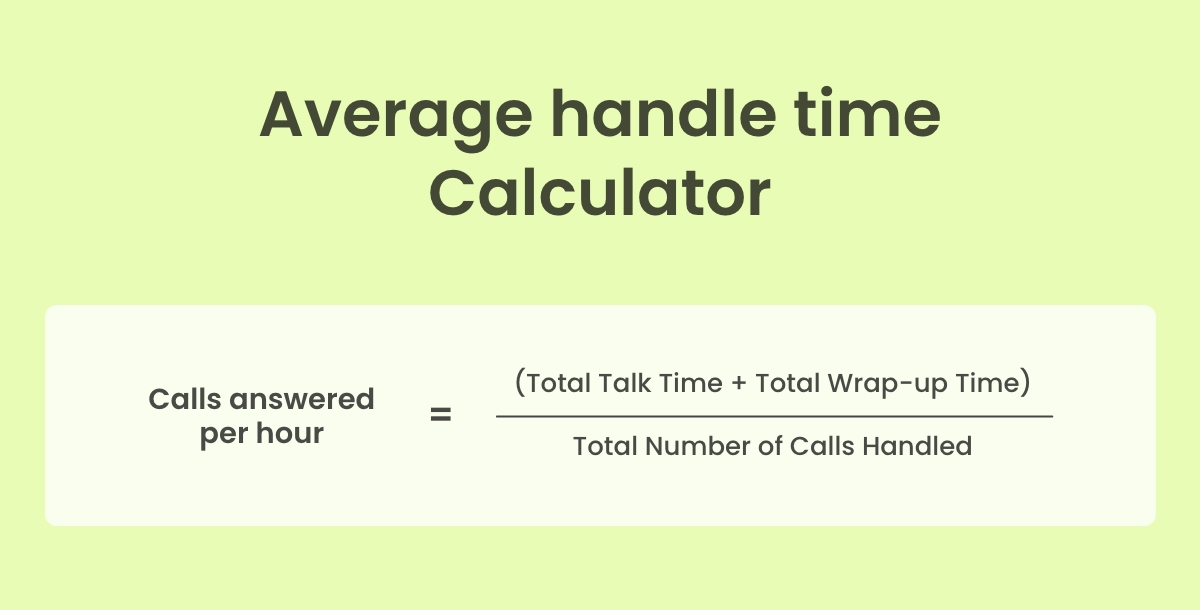
- Average Handle Time: This measures the average duration of customer interactions handled by agents. We aim to keep AHT as low as possible while still providing quality service. Offering agents regular training sessions and access to efficient tools like live chat software can help reduce AHT and improve overall service efficiency.
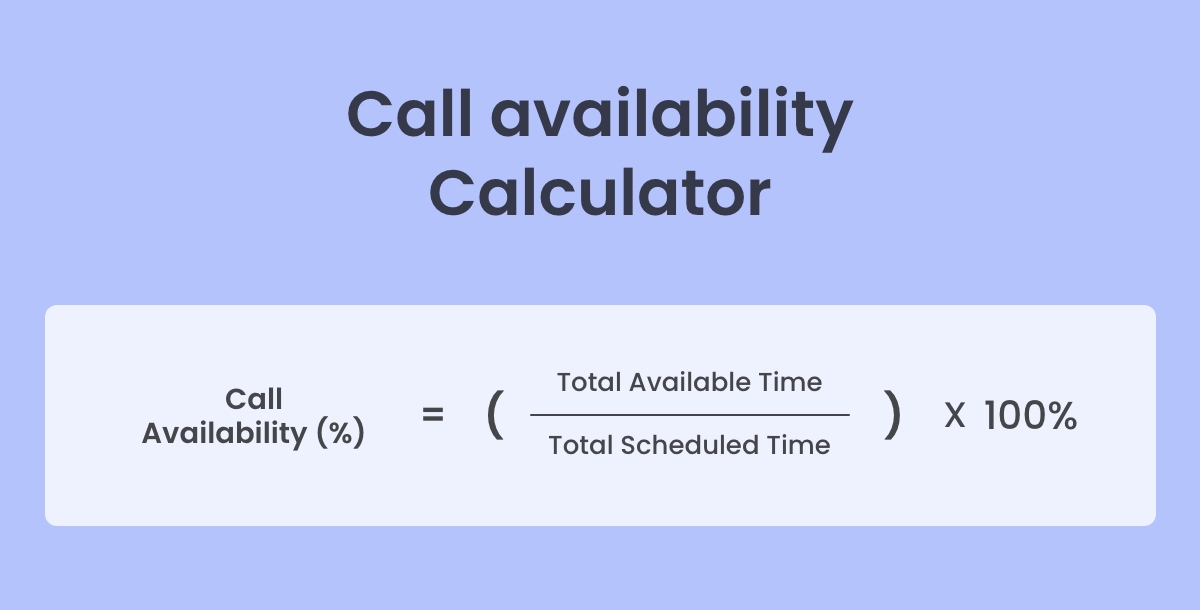
- Call Availability: This indicates the percentage of time agents are available to handle calls during their scheduled shifts. Ensuring high call availability is crucial for meeting customer demand and minimizing wait times. Monitoring agent schedules and adjusting staffing levels as needed can help improve call availability.
- Types of Calls Handled: This provides insight into the nature of customer inquiries and issues handled by agents. Understanding the types of calls agents handle allows us to tailor training programs and resources to better meet customer needs. Regularly reviewing call logs and customer feedback can help identify trends and prioritize areas for improvement.
- Average First Response Time: This tells us how quickly we respond to customers when they first reach out to us. It's important because it shows how fast we're getting to our customers' needs. The quicker we respond, the happier our customers are.
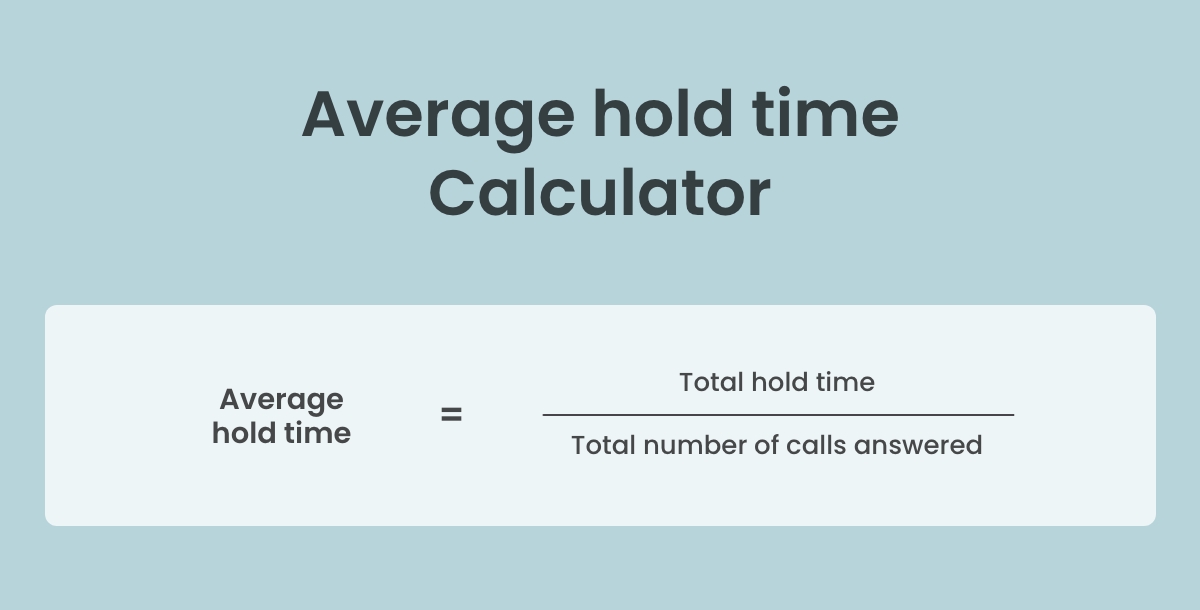
- Average Hold Time: This shows us how long customers have to wait on hold before speaking to an agent. We keep an eye on this because we want to minimize wait times and keep customers from getting frustrated. Shorter hold times mean happier customers.
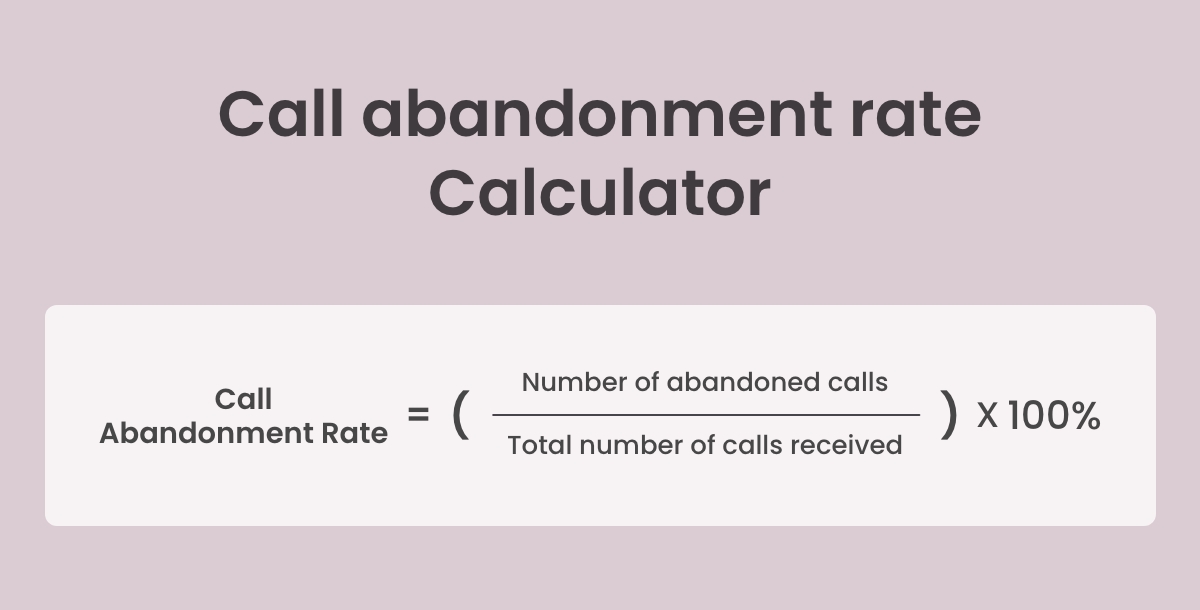
- Call Abandonment Rate: This tells us how many callers hang up before they get to speak to an agent. It's not ideal because it means we're missing out on helping customers. By keeping this rate low, we ensure that customers feel valued and attended to.
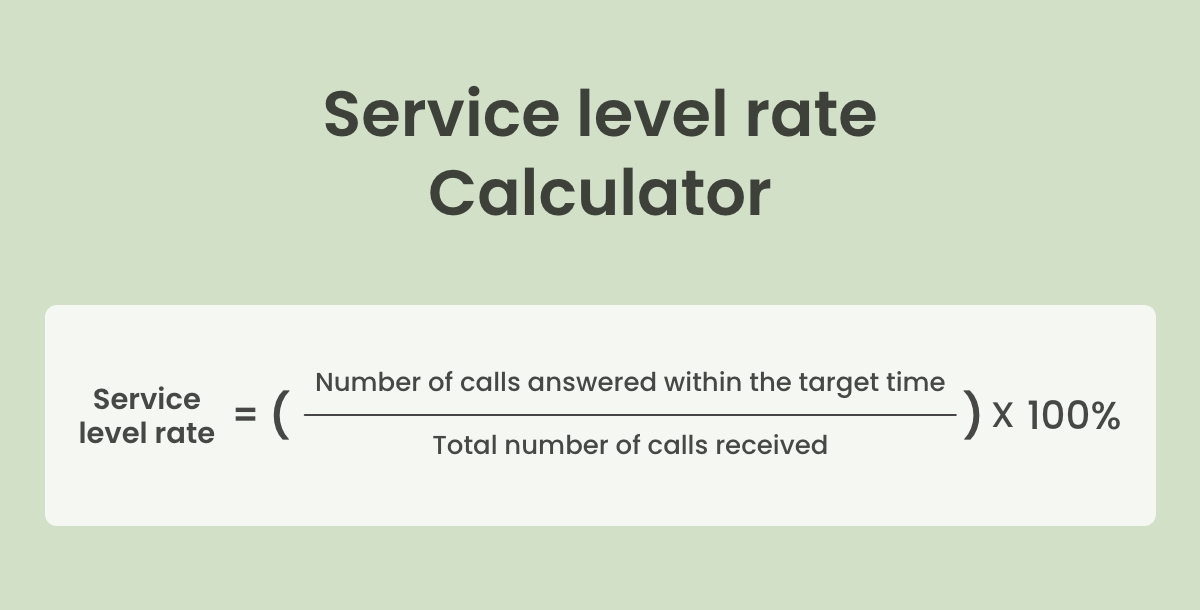
- Service Level Rate: This measures how well we're meeting our service level goals in terms of answering calls within a certain time frame. It's crucial for ensuring that we're providing timely assistance to our customers. Meeting or exceeding our service level goals means we're delivering prompt and efficient service.
- Calls Handled: This metric simply tells us how many calls the call center manages to deal with within a certain period. It gives us an idea of the workload and helps us understand if we're meeting the demand for customer support.
- Cost Per Call: CPC calculates the average cost incurred for each call handled by the call center. It's essential for assessing the financial efficiency of call center operations and identifying opportunities to reduce costs without compromising service quality.
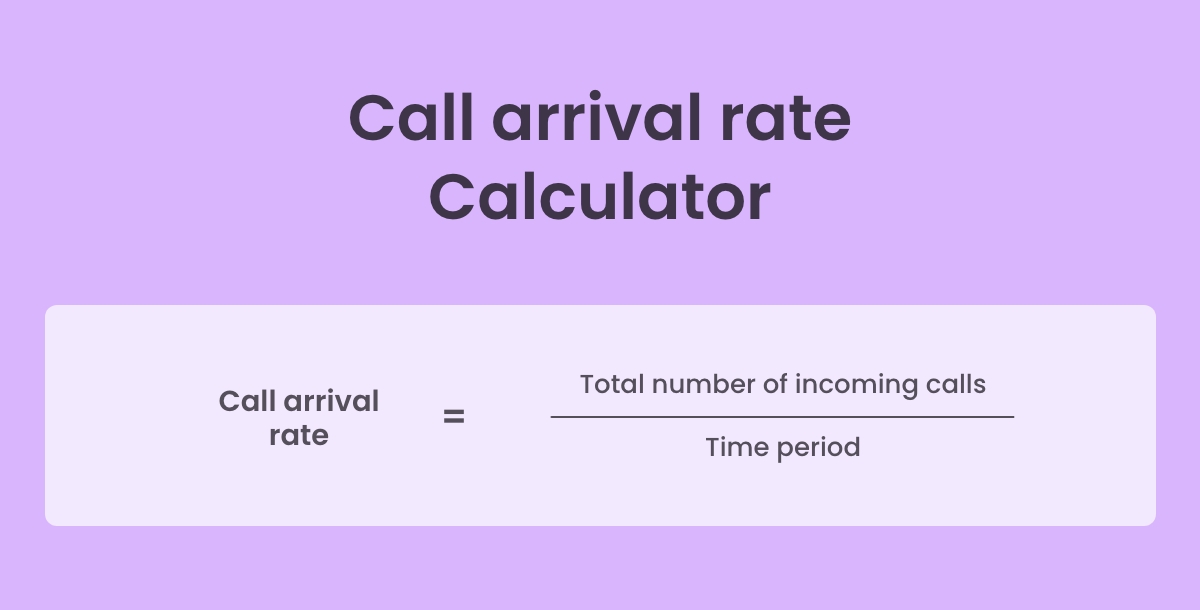
- Call Arrival Rate: Call arrival rate measures the rate at which calls come into the call center. It helps in workforce management and resource allocation, ensuring that there are enough agents available to handle incoming calls during peak times.
- Peak-Hour Traffic: This metric tells us the busiest hours or periods when call volume is at its highest. Understanding peak-hour traffic helps in staffing decisions and ensures that the call center is adequately prepared to handle increased call volumes during busy times.
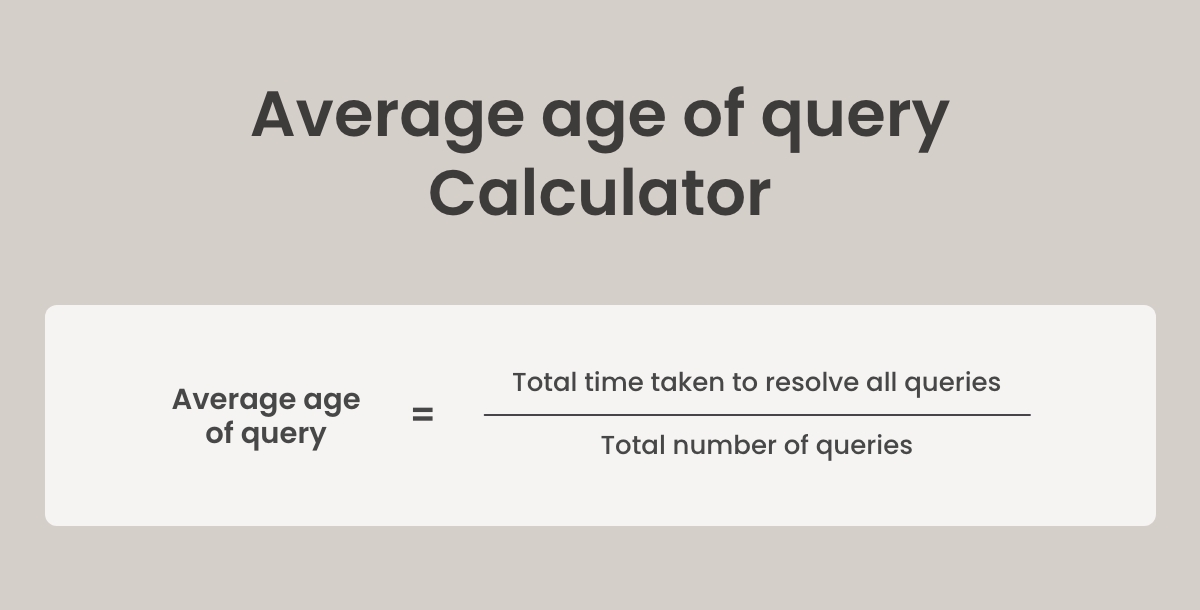
- Average Age of Query: Average age of query indicates the average time it takes for customer queries to be resolved. It's crucial for assessing customer service efficiency and identifying bottlenecks in the resolution process.
- Callback Messaging: Callback messaging refers to the practice of notifying customers when their requested callback is scheduled. It helps in managing customer expectations and ensures timely follow-up on unresolved queries.
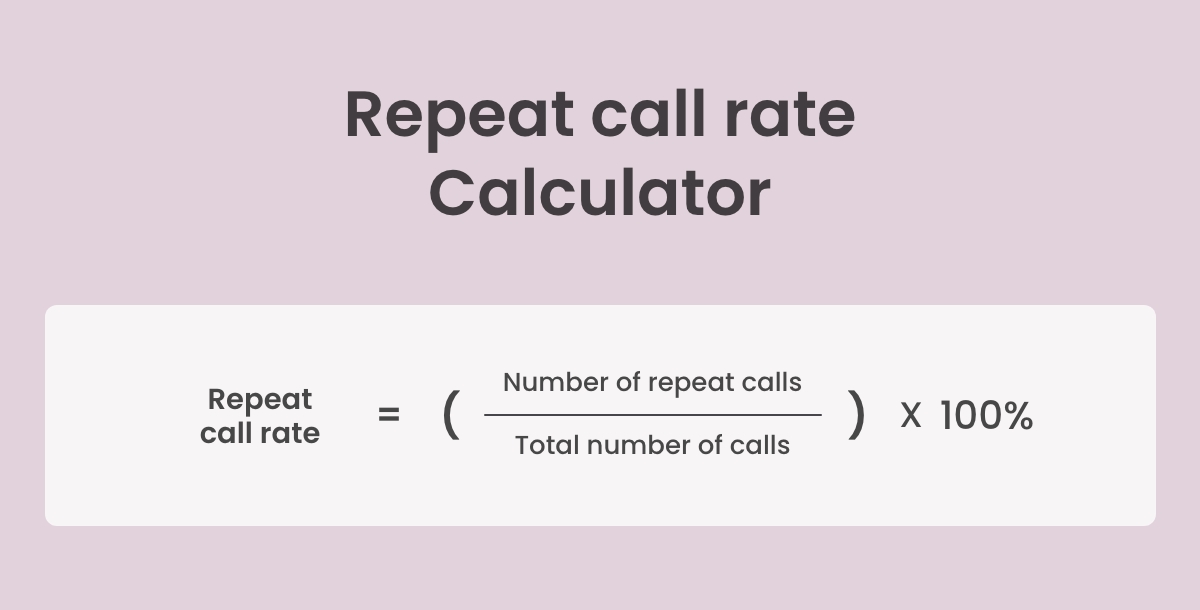
- Repeat Call Rate: Repeat call rate measures the percentage of calls from customers who contact the call center multiple times within a specified period. A high repeat call rate may indicate unresolved issues or dissatisfaction with previous interactions.
- Percentage of Calls Blocked: This metric tells us the percentage of incoming calls that are blocked or unable to be handled due to capacity constraints. It's essential for evaluating call center capacity and identifying opportunities to improve accessibility for customers.


Agent Performance Metrics
Making sure call center agents perform their best is super important for giving customers great service. Let's talk about some things we look at to see how well agents are doing:


Call Inception Metrics
When it comes to handling incoming calls, certain metrics help us understand how well we're doing. Let's break them down:
Call Center Operations Metrics
Call center operations metrics measure the efficiency and effectiveness of call center services, covering aspects like agent performance, customer satisfaction, and call handling. Let's explore some essential metrics that help measure call center operations:

Conclusion
Call center metrics might seem like a complex world, but hopefully this guide has shed some light on how they help make your call center experience smoother. By tracking these metrics, call centers can identify areas for improvement and ensure you receive the efficient, friendly service you deserve. So next time you call a customer service line, remember that there's a whole world of metrics working behind the scenes to make your experience as positive as possible!
Related Articles
- Best Fotor Alternatives for Designers and Businesses in 2023
- 12 Ways to Increase Sales for Your Cleaning Business
- What is Brainstorming: Techniques for Effective Problem Solving
- Discover the Best MailerLite Integrations
- Enhancing Customer Value: The Key to Business Success
- 6 Best Time Tracking Apps for Better Monitoring
- Symbolic Learning Enables Self-Evolving Agents
- Training Large Language Models: Delving Deep into Methodologies, Challenges, and Best Practices for Training LLMs
- Pink Background: Tips and Tricks for Designers and Marketers
- 110+ Stress Quotes to Help You Find Your Calm
Most Popular Posts
- Sales CRM: Definition, Types, Roles and Selection
- The 5 Best eCommerce Platforms to Build an Online Store with Top Integrations
- Understanding and Fixing 403 Errors Like a Pro (+Bonus Glossary)
- From Concept to Creation: Making the Most of Midjourney’s AI Image Generator
- A Simple Guide on How to Rotate Photos on iPhone & iPad