How to Make a Graph in Excel: A Step-by-Step Guide for Beginners
Similar to the desktop version of Excel, Excel Online also offers all the necessary features including making charts and graphs.
Here is how you can make a chart or Graph in Excel Online:
Choose the data you would like to incorporate in your Graph and then click on the ‘Insert’ section of the toolbar, where you will find a collection of icons for creating charts.
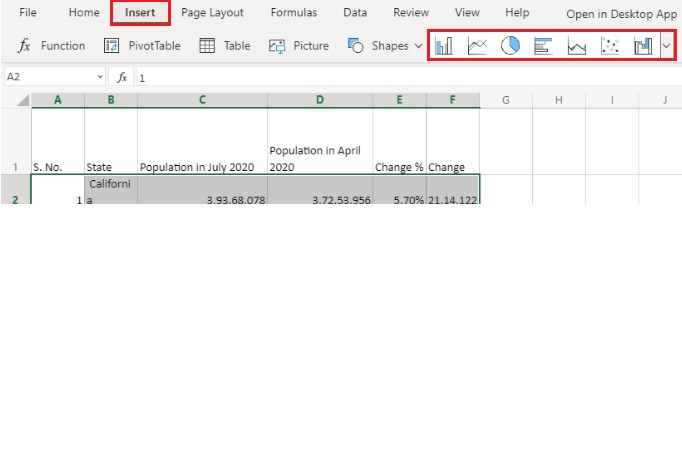
You can click on any of the highlighted icons to create the corresponding kind of chart. Or, if you need more options, click on the arrow on the right side of the box.
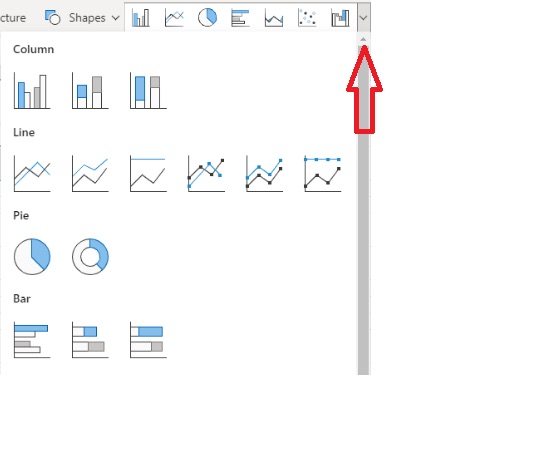
To read a description, take your mouse to any chart type.
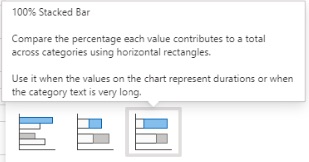
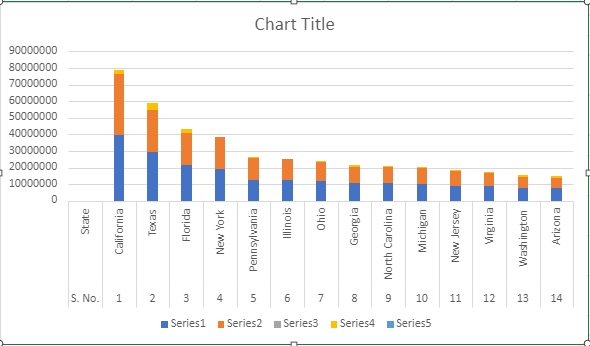
Depending on your need, you can choose your chart type. Here we have collected a spreadsheet of US population data in a state-wise manner. If we choose the column with the state names along with one year’s worth of data, we can create a bar graph easily comparing the top 8 U.S. states in terms of population.
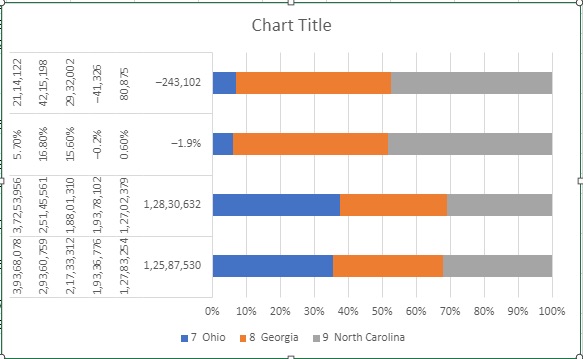
Below chart shows how the population changed:
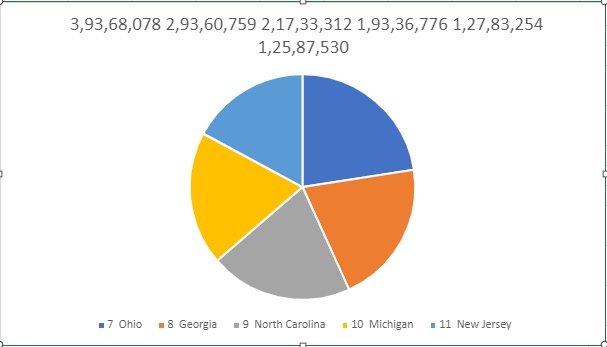
And the below pie chart shows the population by state:
You can modify your graph by choosing it and making use of the ‘Chart’ section of the toolbar.
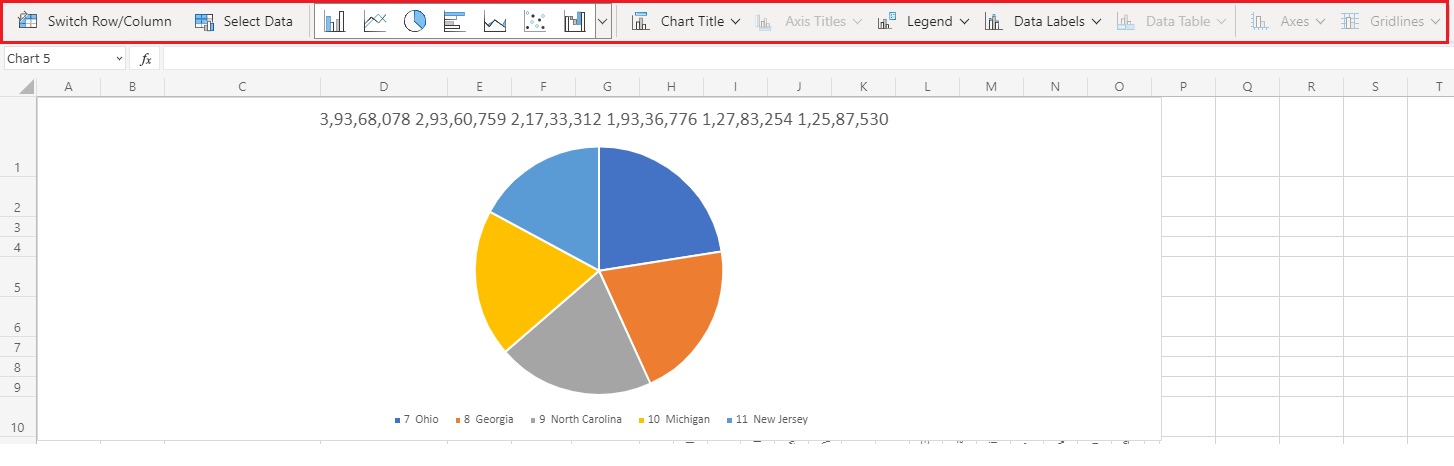
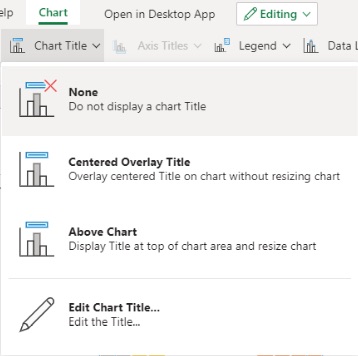
For instance, you can also change the chart’s name.
If needed, you can also choose where the legend should be.
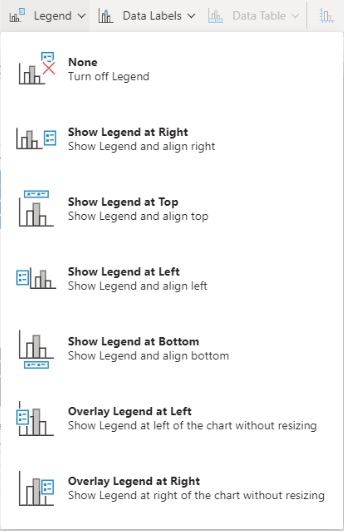
From the given options in the toolbar, you can make your chart the way you want. Graphs/charts improve your data by providing an easy-to-understand visualization of numeric values. Individuals use graphs/charts in presentations to give clients, management, or team members a rapid glimpse into progress/results. With Appy Pie Connect, you can integrate Excel with 150+ other apps to automate the tedious & repetitive tasks in no time. With the Appy Pie Connect and Excel integration, you can share your spreadsheets with other stakeholders & team members.