
How to Make a Flowchart using AI: Tips to Create a Better Flowchart

When you've to explain a complex process or a long strategy, communicating it with a big group of people could be a challenge. How would you ensure everyone on the team is on the same page? How do you confirm that you'd be able to cover all areas in your discussion?
In order to develop and streamline processes for marketing and business management, a flowchart maker has become a go-to thing. Along with being one of the most used project management tools, it also plays a crucial role in cross-departmental operations.
Managing a project on multiple levels is not a very easy task. We all have seen that without a project management tool, it's actually trouble. Irrespective of the industry you're part of, the management process can get really messy, and that's where our free flowchart maker comes into action.
Please keep reading to learn about flowchart making, why it is essential, and how it makes your life easier.
Meaning of a Flowchart and its Objective
The graphical or visual representation of any business process in sequential order is known as the flowchart of that specific process. In simpler terms, it is a way of mapping out business processes in order to explain the flow in steps. The method of drawing flowcharts has multiple ways but using symbols with a brief description for depicting each step is a must.
A flowchart maker offers flexibility and value for designing and managing a process. A few years ago, flowcharts were only for planning computer programs; however, with technical advances, instead of programming per se, engineers have started using them for describing computer algorithms.
Over time, other professionals from various fields also jumped in and started using flowchart makers in order to design and manage projects. It is also used for optimizing existing business processes.
Anyone looking to map out new projects or evaluate the existing ones can use a flowchart or graph. It helps you visualize each step, and the structures are flexible enough to fit any project need. And that's why it has not been so long since flowchart makers have become so popular.
A flowchart or graph can be used by anyone looking to map out new projects or evaluate the existing ones. It helps you visualize each step, and the structures are flexible enough to fit any type of project need. And that's why it has not been so long since flowchart maker has become so popular.
Objectives to create a Flowchart in a Project
- Visualizing interactions between each step of any business process.
- Evaluating the efficiency of business processes and optimizing them for better results.
- Enhancing cross-departmental communication and presenting stakeholders.
As discussed above, it's not essential to be a tech-savvy or software developer to use flowcharts. However, with a flowchart maker, anyone can go for it. For example, a business manager can use it for analyzing sales flow and procurement processes. Software developers use it to map out systems, evaluate development processes, and describe computer algorithms. Drawing flowcharts can help a graphic designer learn about the task flow. In contrast, a marketing team can learn more about the sales process and flow.
Therefore, a flowchart maker can help you design and manage projects from any industry, and anyone can benefit from this project management tool, irrespective of their job role.
Pros and Cons of Flowcharts
- Pros
- Helps to understand complicated processes easily and ensures the same level of understanding for everyone.
- Helps to save time & effort on analyses and issues related to it.
- Assists in creating documents and sharing processes.
- Cons
- Even for minor changes, the whole flowchart must be redrawn when the process changes.
- If your procedure has too many steps, your flowchart looks complicated and messy in order to comprehend.
Most Common Types of Flowchart with their Uses
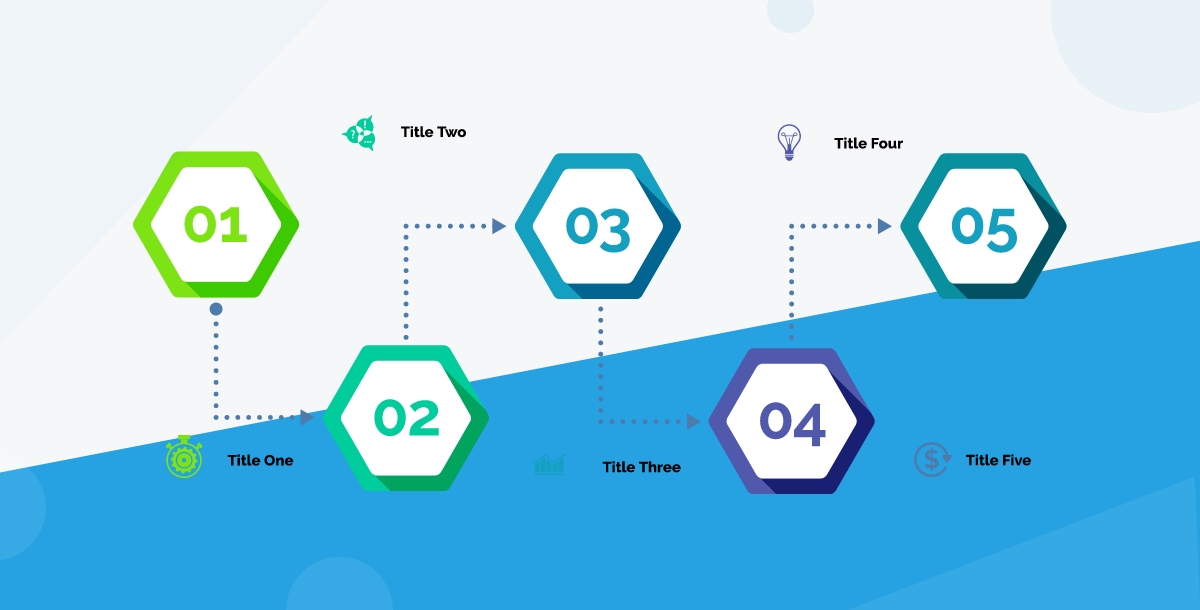
Process Flowchart: A process flowchart is a diagram showing the steps performed to complete a business process. The purpose of the flow chart is to show how information flows through a process and to indicate where decisions are made. Flowcharts can be simple or complex, depending on their intended audience.

It helps plan a new project, map system requirements, or evaluate development processes. Depicting each process step by step, this flowchart is mainly used by software developers and designers.
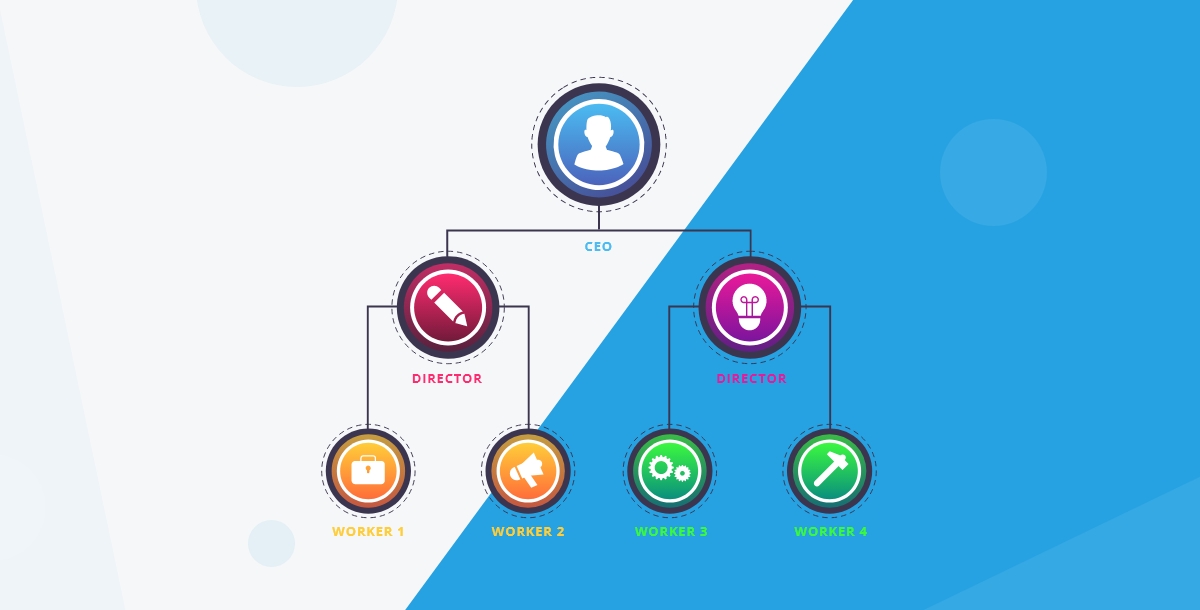
Work Flowchart: A work flowchart is a visual representation of the steps that are required to complete a process. The image below is an example of a simple workflow chart of a Company. This example shows the basics of a corporate structure.
It is used for managing workflows and mapping business functions. Also, it helps in standardizing procedures and integrating automated processes. This type of flowchart is mainly used by project and business managers.
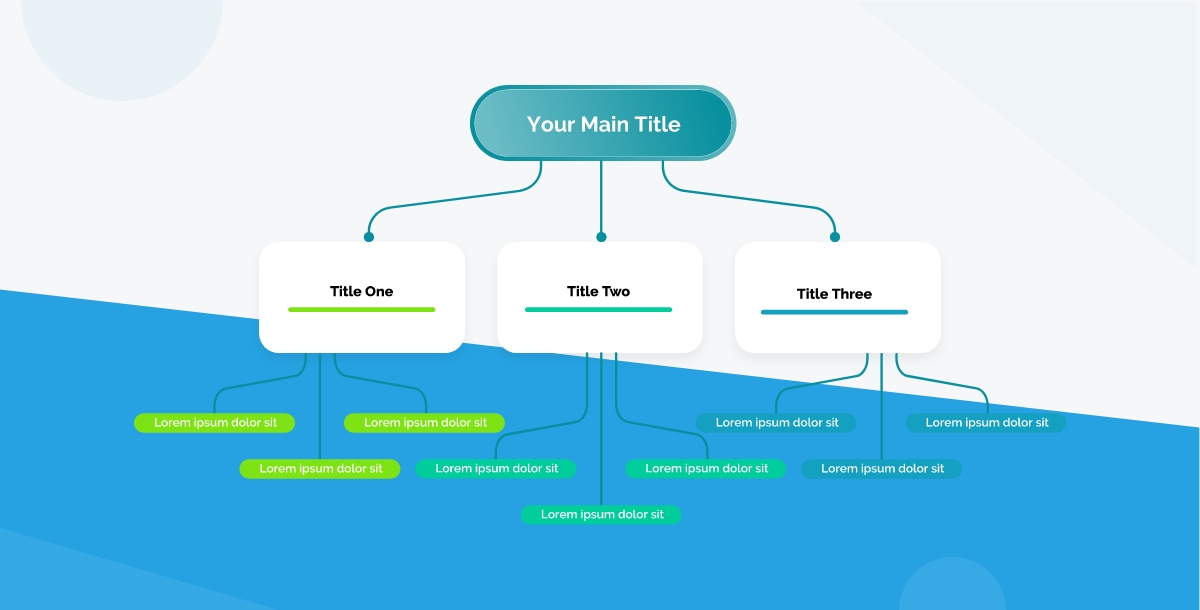
Swimlane Flowchart: A swimlane flowchart is another type of flowchart used to visualize the process flow. It is also known as a modified flowchart. The term swimlanes refers to the horizontal lanes that separate the activities on the flowchart. These lanes represent different functional units or departments involved in the process. It is similar to a traditional flowchart but has an additional dimension where activities are divided into other groups.
It helps in managing workflows across multiple departments. It is also used for enhancing collaborative processes and picturing processes in different departments of an organization. This flowchart is mainly used in cross-functional teams.
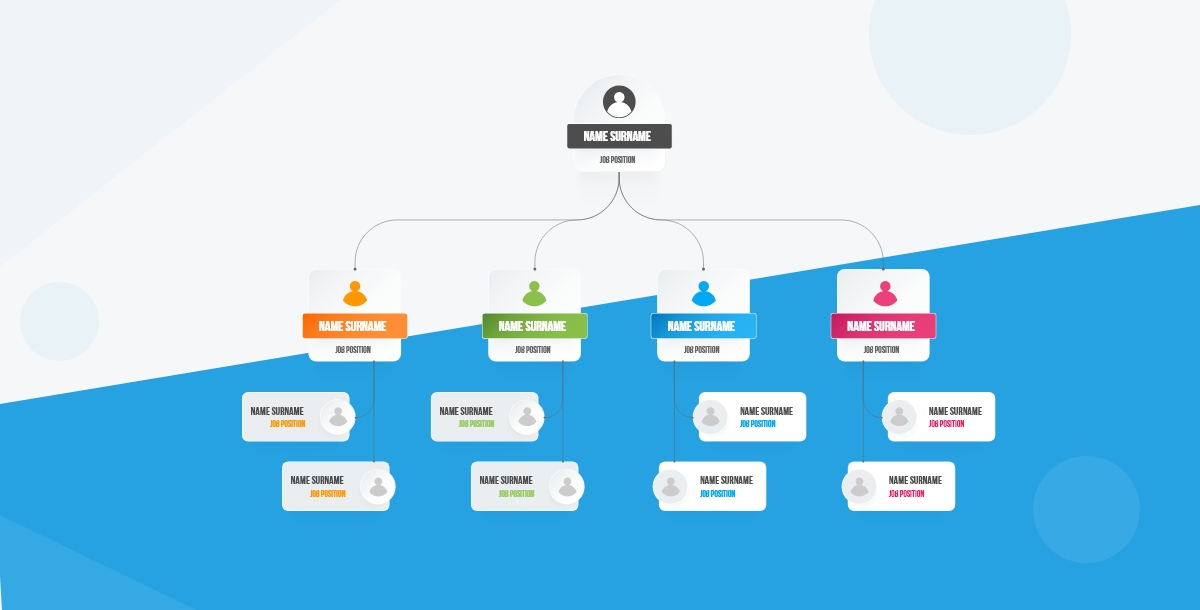
Data Flowchart: A data flowchart is a diagram that shows how data moves through an information system. Data flows are shown as arrows. At the start and end of a data flow, you can identify the type of actor that initiates the flow and the kind of actor that uses the flow. The initiating actor can be a human, software module, or hardware component. The receiving actor can be a human, software module, or hardware component. You can also show multiple data flows in a single diagram.
This flowchart helps in bridging communication between users and systems. It is used to depict how data has been processed in order to make data-oriented decisions. This flowchart is used by many professionals, from marketers to engineers.
Things one must consider while Drawing a Flowchart
People often feel there's not much that exists when it comes to explaining how flowchart works. However, there's much more than just connecting shapes and arrows when drawing flowcharts. Below are a few tips that you must know to create better flowcharts in the future.
- Templates
While learning to draw a flowchart, going for a suitable template while exploring all available options helps you understand and present information more sequentially and logically. Also, it helps to do it in such a way that it looks visually appealing. The general template options are divided into various categories: engineering, network, business, maps, floor plans, etc. However, it's still worth exploring if you feel going for a template might not be suitable for you.

- Always go for Consistent Design Elements
Using consistent design elements on the same chart is very important. Flowcharts should be easily understood and in order to do that, going for consistent shapes in terms of decision points and tasks helps in knowing what needs to be done at each step in the process. In addition to that, to acquire a clean and professional look, all the shapes are meant to be of a similar size, and the lines and spacing used must be identical. Thus, using consistent design elements will help in giving it a natural flow, and eliminating or reducing distraction and confusion will be a lot easier.
- Play with Color
In order to improve engagement, the role of color is very critical. Working within the confines of the same palette is suggested for a clean look. However, it's essential to vary shades for each step described in the process. For example, you can use sage green to highlight decision points; a peach color always looks good to depict all the tasks, and burnt orange to end graphics. This helps in keeping your flowchart interesting and eliminates confusion. You can go with Appy Pie's Color Picker tool that allows you to choose the colors of visual elements like text or fonts in a document, graph, or flowchart.
- Use your words Wisely
Though a flowchart is a visual representation of business processes, it's essential to augment it with an explanation. With accurate information and context, words can help users understand flowcharts. However, be brief; instead of using complete sentences, try to use 3-4 words.
Our free flowchart maker will help you explore and experiment with various available templates and tools if you're a beginner in flowcharts. Learn to create flowcharts that can provide the correct information now. Happy Diagramming!


Related Articles
- How to get your app published to the iOS store?
- Top 10 Web Design Certifications to Elevate Your Career
- Button Design Essentials:Best Practices and Creative Designs
- Free Business Name Generator to Generate Company Name Ideas Online
- Types of Sales: Mastering the Art with Technology
- 7 Pipedrive Integrations to Boost Your Productivity
- Holi Festival of Colors: A Colorful Journey Through History, Legends, and Celebrations
- Zoom Meeting Etiquette: Best Practices for Participants
- How to Use Google Docs Version History
- How To Build A Consultant Business Plan